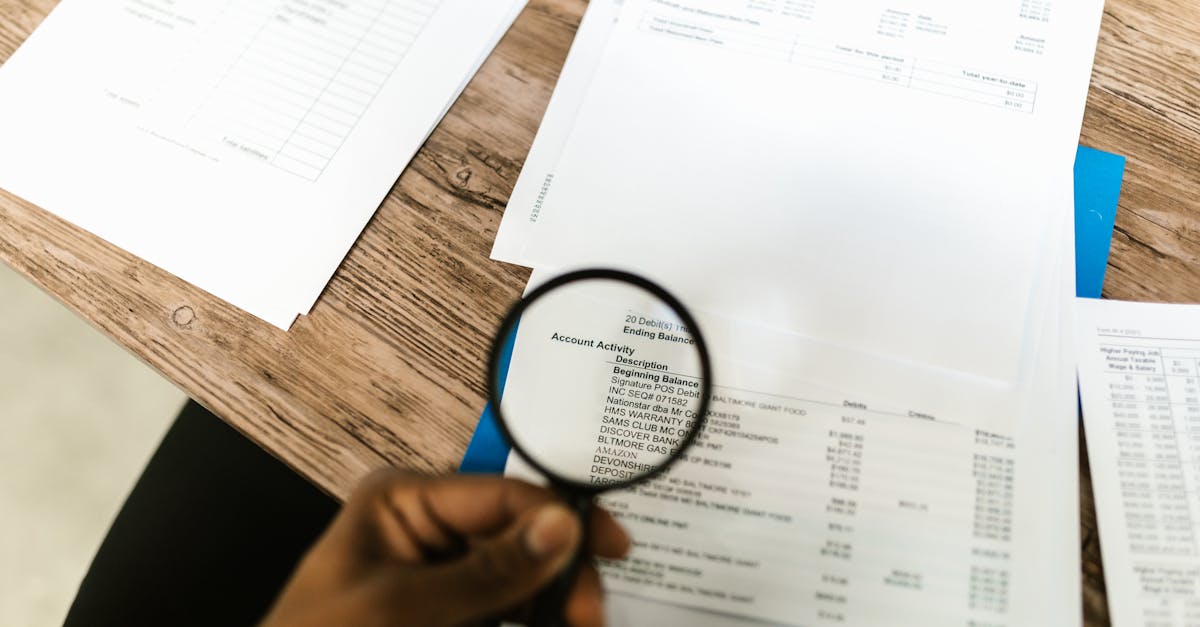
How To Read A Financial Statement Like A Pro
Have you ever stared at a corporate financial statement and felt like you were reading an ancient language written in hieroglyphics? You are certainly not alone. For most people, a balance sheet looks like a messy grocery list, and an income statement feels like a confusing puzzle. But here is the secret: once you learn the basic grammar of these documents, they start to tell a compelling story. Learning to read financial statements is like learning to read a roadmap for a company. If you want to invest wisely or manage a business effectively, you need to understand where the money is coming from and exactly where it is going.
What Are Financial Statements and Why Do They Matter?
Financial statements are the official report card of any business. They provide a standardized way for companies to communicate their performance to the world. Think of them as the vitals signs of a living organism. Just as a doctor checks blood pressure and heart rate, an investor checks revenue and debt to see if the company is thriving or struggling. Without these documents, you are essentially flying a plane blindfolded. You need them to make informed decisions rather than just guessing which stock might go up next.
The Balance Sheet: Taking a Snapshot of Financial Health
The balance sheet is a frozen moment in time. It shows you exactly what a company has and what it owes at a specific date. The fundamental equation here is Assets equal Liabilities plus Shareholders Equity. If you can remember that, you have already won half the battle.
Assets: What the Company Owns
Assets are anything the company owns that has monetary value. This includes cash in the bank, inventory sitting in a warehouse, or even patents and property. Assets are usually categorized into current assets, which are things that can be converted to cash within a year, and long term assets, like machinery that stays on the books for decades.
Liabilities: The Debt Burden
Liabilities are the obligations. If you borrowed money from a bank or promised to pay a supplier for raw materials, that is a liability. It is the weight the company is carrying. Too much debt can sink a business, even if it is making a profit, because it has to keep up with those mandatory payments.
Shareholders Equity: The Real Value
This is what is left over for the owners after you subtract the liabilities from the assets. If the company were to sell everything it owns and pay off everyone it owes, this is the pile of cash that would belong to the shareholders. It represents the true net worth of the firm.
The Income Statement: The Story of Profitability
While the balance sheet is a snapshot, the income statement is a movie. It tracks performance over a period, like a quarter or a year. It tells you if the company is actually generating more cash than it is spending.
Revenue Streams: Measuring Top Line Growth
Revenue, often called the top line, is the total amount of money brought in by sales. This is the starting point. If the revenue is growing, the company is likely expanding its market share or increasing its prices. It is the fuel for the entire engine.
Operating Expenses: Where the Money Goes
Running a business is expensive. You have to pay employees, rent offices, buy marketing, and maintain technology. These are the operating expenses. The key is to see if these expenses are growing slower than the revenue. If they are growing faster, the company is becoming inefficient.
Net Income: The Bottom Line Result
This is the final prize. After all costs, taxes, and interest payments have been deducted from the revenue, you are left with net income. This is the true profit. Investors love to see a healthy net income because it is the source of dividends and potential share buybacks.
The Cash Flow Statement: Following the Actual Money
You might be surprised to learn that a company can show a profit on paper but still run out of cash. This is why the cash flow statement is arguably the most important document of the three. It traces the actual physical movement of cash through the company doors.
Operating Activities: The Core Engine
This section shows how much cash the company generates from its primary business operations. If a software company makes most of its money by selling subscriptions, this section tracks the cash flow from those subscriptions. Positive cash flow from operations is a sign of a healthy, self sustaining business.
Investing Activities: Future Growth Plans
When a company spends money on new factories, research and development, or buying other companies, it shows up here. Usually, companies that are in high growth mode will have negative cash flow in this section because they are spending heavily to build the future.
Financing Activities: Debt and Equity Movements
This section tracks cash that comes in from issuing new stock or taking out new loans, and cash that goes out when paying off debt or paying dividends. It shows you how the company manages its capital structure.
Essential Ratio Analysis: Reading Between the Lines
Now that you have the raw data, you need to turn it into insights. Ratios allow you to compare companies regardless of their size. It levels the playing field.
Liquidity Ratios: Can They Pay the Bills?
Liquidity ratios like the current ratio tell you if the company can cover its short term debts. If the ratio is below one, the company might be in a liquidity trap. You want to see enough liquid assets to cover those immediate obligations comfortably.
Profitability Metrics: How Efficient Is the Machine?
Return on Equity, or ROE, is a favorite among professional investors. It shows how much profit a company generates for every dollar shareholders have invested. A high ROE generally indicates that management is incredibly efficient at allocating capital.
Conclusion: Becoming a Master of Financial Literacy
Learning to read financial statements is not about memorizing complex formulas; it is about building a habit of curiosity. When you look at these documents, do not just scan for the biggest numbers. Instead, look for the trends. Is the debt increasing? Is the profit margin shrinking? Once you start asking these questions, you will realize that you are seeing through the corporate PR and getting straight to the truth. Keep practicing, stay patient, and eventually, you will be able to analyze a balance sheet as quickly as you check the weather forecast. You now have the fundamental toolkit to start looking at businesses with the eyes of an expert.
Frequently Asked Questions
1. Why is cash flow different from net income?
Net income includes non cash items like depreciation, whereas the cash flow statement only tracks actual movement of money in and out of bank accounts.
2. Should I worry if a company has high debt?
Not necessarily. Debt can be a powerful tool for growth. You should only worry if the company cannot generate enough cash to comfortably cover the interest payments on that debt.
3. How often should I check these financial statements?
Most public companies report every quarter. Checking them every three months is usually enough for the average investor to track the long term health of the company.
4. Can a company be profitable but failing?
Yes. If a company is profitable but has negative cash flow, it may eventually run out of the cash needed to keep operations running, which can lead to insolvency.
5. Is it better to look at one statement or all three?
Always look at all three. They are like a three legged stool; if you rely on only one, you lose the stability and context of the complete financial picture.